The financial markets are driven not only by earnings, rates, and data—but also by emotions. Fear and greed shape price movements every single day, and traders have long sought a way to quantify these emotional tides. That’s where the VIX Index comes in. Known as Wall Street’s “fear gauge,” it measures market expectations of volatility in the S&P 500 and serves as an indispensable tool for modern traders.
In this comprehensive guide, we’ll explore how the VIX works, how to read its signals, and how to integrate it into a trading strategy using platforms such as Ultima Markets. You’ll also learn how to interpret risk, seize opportunities during volatile periods, and use advanced trading tools like Ultima Markets MT5 to navigate turbulence with precision.
What Is the VIX Index and Why It Matters
The VIX, short for the CBOE Volatility Index, represents the market’s forecast of expected volatility for the next 30 days. It’s calculated using real-time option prices from the S&P 500 Index (SPX), making it a forward-looking sentiment gauge rather than a historical one.
Essentially, the VIX quantifies how much investors are willing to pay for protection against potential price swings. Higher option premiums indicate growing fear—while lower ones suggest calm and confidence.
| VIX Level | Market Mood | Typical Market Behavior |
| Below 15 | Complacent | Steady growth, low hedging activity |
| 15–25 | Watchful | Mild uncertainty, occasional dips |
| 25–35 | Nervous | Frequent fluctuations, hedging rises |
| Above 35 | Panic | Sharp sell-offs, extreme volatility |
The Psychology Behind the “Fear Gauge”
When investors panic, they buy put options to hedge losses. The surge in demand drives option prices higher—and the VIX rises. Conversely, when optimism dominates, traders buy fewer protective options, causing volatility measures to fall.
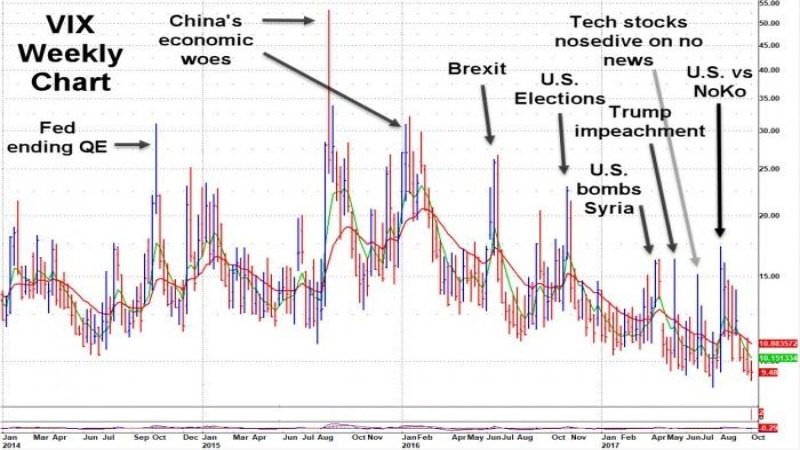
This behavior creates a clear inverse correlation between the VIX and stock prices. During calm, bullish markets, the VIX remains low. When crises strike, it spikes sharply.
Example: During the 2008 Financial Crisis, the VIX hit 89.5. In the March 2020 pandemic crash, it surged above 82. Each spike marked a moment of intense fear—followed by some of the strongest rebounds in history.
How to Read VIX Levels Like a Professional Trader
Understanding VIX ranges helps traders anticipate market behavior before major shifts occur. Here’s how to decode the message behind the numbers:
VIX Below 20: Calm Seas and Complacency
A reading below 20 often signals a tranquil market environment. Investors feel confident, volatility is subdued, and risk assets tend to trend upward. Yet, extreme calm (below 12) may warn of complacency—where traders ignore potential risks.
VIX Between 20–30: The Amber Zone
This mid-range signals rising uncertainty. Markets may experience broader price swings. It’s the zone where traders tighten stop-losses, reduce leverage, and prepare for potential corrections.
VIX Above 30: Peak Fear, Hidden Opportunity
A high VIX reading means stress—but also opportunity. Many successful traders view these spikes as entry points. When fear reaches an extreme, assets are often oversold, providing attractive long-term buying chances.
How to Use the VIX in Your Trading Strategy
The VIX is not directly tradable—but it informs strategy across multiple instruments. Below are three proven ways to apply it in your day-to-day trading.
1. Hedging with Volatility Instruments
Institutional investors often hedge equity portfolios with VIX-related assets. If you expect turbulence, you can offset potential losses by buying volatility-linked derivatives such as VIX futures or ETFs.
Platforms like Ultima Markets allow traders to take positions on volatility indirectly via indices such as the S&P 500 (US500) or NASDAQ (USTEC). When volatility rises, shorting these indices through CFDs can protect portfolios from drawdowns.
2. Contrarian Signal Detection
The VIX often acts as a contrarian indicator:
- High VIX → Buy opportunities (markets oversold)
- Low VIX → Caution (markets overbought)
This principle aligns with Warren Buffett’s famous line: “Be fearful when others are greedy, and greedy when others are fearful.”
3. Timing Entries and Exits with VIX Confirmation
VIX levels can validate or challenge your market thesis. If your technical analysis suggests a bullish setup but the VIX rises unexpectedly, it might signal hidden market stress. Combining VIX analysis with trend indicators strengthens decision-making accuracy.
Ultima Markets: Turning Volatility Into Strategy
To apply VIX insights effectively, traders need a platform that delivers speed, transparency, and fund protection. That’s where Ultima Markets stands out.
- Secure Fund Management: Ultima Markets fund safety ensures traders’ capital is protected in segregated accounts, providing peace of mind during volatile periods.
- Professional Trading Infrastructure: Trade on Ultima Markets MT5, the advanced platform offering multi-asset access, automated trading, and deep liquidity.
- Efficient Money Flow: Enjoy reliable Deposits & Withdrawals so you can focus on trading, not administration.
- Transparent Feedback: Explore authentic Ultima Markets Reviews to see how other professionals use the platform during periods of high volatility.
Whether you’re hedging exposure or speculating on volatility trends, these tools help convert uncertainty into strategy.
Common Pitfalls in Trading the VIX
1. Misunderstanding VIX Products
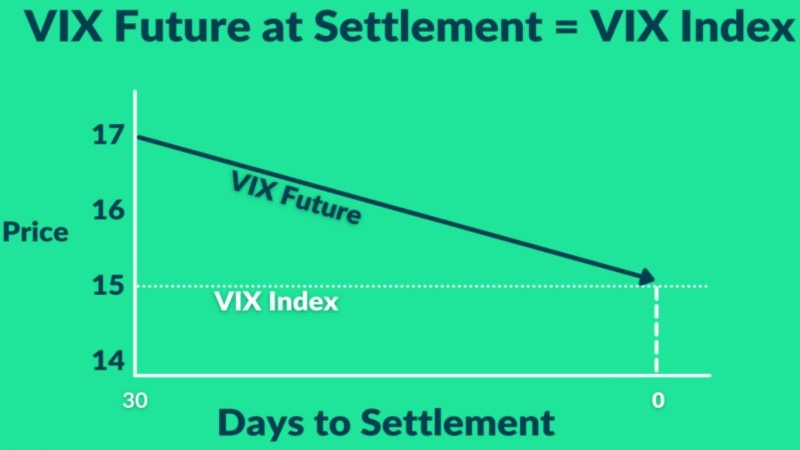
Products like VXX (ETN) or UVXY (ETF) track short-term VIX futures—not the index itself. They are subject to “contango,” a condition where longer-dated futures cost more than near-term ones. Rolling these contracts continuously causes performance decay.
2. Holding Volatility ETFs Too Long
Due to roll costs and daily rebalancing, these instruments lose value over time. They are suitable for short-term trades—not long-term holdings.
3. Ignoring Broader Market Context
The VIX doesn’t predict crashes—it reflects current fear. Always combine it with technical and macroeconomic analysis.
Integrating VIX Data Into Broader Market Analysis
A complete trading system merges volatility data with trend, momentum, and sentiment metrics. Here’s a simple framework:
| Indicator | Focus | Trader’s Use |
| VIX | Volatility | Gauge market fear, confirm sentiment |
| Moving Averages | Trend | Identify direction and stability |
| RSI | Momentum | Detect overbought/oversold conditions |
| Correlation Coefficient | Relationship | Track equity-volatility inverse pattern |
Cross-referencing these metrics refines your entries and exits. For example, a spike in VIX combined with an RSI oversold reading on the S&P 500 often signals exhaustion of selling pressure—potentially a buy signal.
Case Study: Using VIX for Strategic Entry Timing
Imagine you’re trading the US500 CFD on Ultima Markets MT5. The market drops 5% over three sessions, and the VIX climbs from 19 to 35.
At this stage, institutional traders are panic-hedging. You analyze RSI (oversold at 28) and price nearing a long-term moving average. These confluences suggest exhaustion. You enter a small long position, placing a stop-loss below recent lows.
Within two weeks, the VIX cools to 22 as fear fades, and the index rebounds 7%. The trade capitalizes on emotional extremes by combining volatility insight with technical logic.
Why VIX Remains Relevant in Modern Markets
Even with algorithmic trading dominating volume, fear and uncertainty remain human constants. The VIX encapsulates this sentiment instantly. As global events—from rate decisions to geopolitical tensions—unfold, the VIX remains the fastest reflection of collective trader psychology.
For professionals on platforms like Ultima Markets, tracking VIX behavior provides an invaluable edge. It helps identify when risk premiums are overstated or underpriced, guiding better position sizing and capital allocation.
Conclusion: Turning Fear Into Foresight
The VIX Index transforms abstract fear into measurable data. It doesn’t eliminate risk—but it empowers you to recognize it early, manage it intelligently, and seize opportunity amidst uncertainty.
By integrating VIX insights with platforms that prioritize fund security and execution quality—like Ultima Markets—you can navigate volatility with confidence and precision.
FAQ
Q1: What does a high VIX mean for investors?
A high VIX indicates increased fear and uncertainty. Historically, extreme VIX spikes often coincide with market bottoms, as panic selling reaches its peak.
Q2: Can I trade the VIX directly?
No. The VIX is an index, not a tradable asset. However, you can trade volatility through futures, options, or CFDs on related instruments via Ultima Markets MT5.
Q3: Is a low VIX always good for the market?
Not necessarily. While it reflects stability, ultra-low readings may signal complacency—often preceding corrections.
Q4: How do VIX ETFs differ from the index?
ETFs such as UVXY or VXX track VIX futures, not the index itself. They decay over time due to contango and should only be used for short-term exposure.
Q5: What’s the role of risk management when trading during high VIX levels?
Risk management becomes critical. Keep positions smaller, use tighter stop-losses, and maintain liquidity flexibility—supported by reliable Deposits & Withdrawals systems from platforms that emphasize fund security, such as Ultima Markets fund safety.