

Before you can run, you must learn to walk. In futures trading, understanding the fundamental building block of every chart—the Futures K-Line Chart, also known as the candlestick—is that first crucial step. It is the DNA of market sentiment, compact yet information-dense, and forms the analytical foundation used by professional traders across platforms such as Ultima Markets.
What is a K-Line (Candlestick)? The Four Key Prices
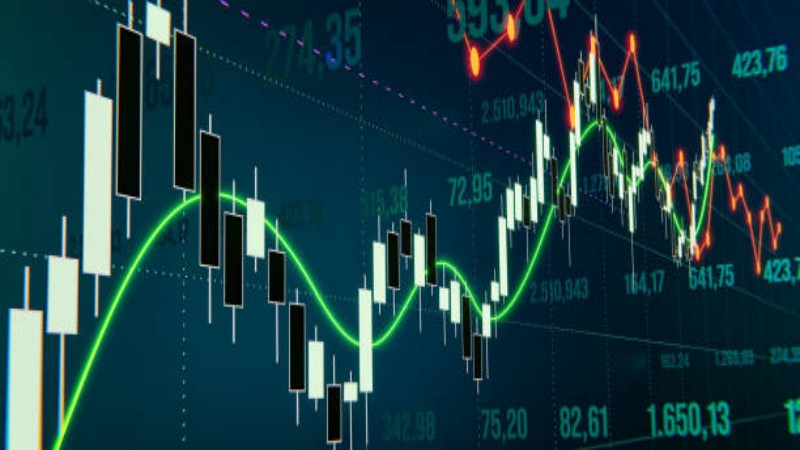
A Futures K-Line Chart is composed of individual candlesticks, each representing a fixed time period—one minute, one hour, one day, or even one week. Every candlestick tells a complete story of price behaviour within that interval, visualising the ongoing contest between buyers (bulls) and sellers (bears).
Each K-line contains four essential data points:
- Open: The price at the very beginning of the selected period.
- High: The highest price the asset reached during that period.
- Low: The lowest price the asset fell to during that period.
- Close: The price at the very end of the period.
The main rectangular part is called the ‘real body’, which represents the range between the open and close price. The thin lines extending above and below the body are the ‘shadows’ or ‘wicks’, showing the full range from high to low.


Reading the Colours: The Battle Between Bulls and Bears
Within a Futures K-Line Chart, colour conveys immediate directional information. Although colour schemes can be customised on platforms like Ultima Markets MT5, the standard convention remains widely used:
-
Green (or White) Candle – Bullish: The close is higher than the open, indicating buyer dominance and positive momentum.
-
Red (or Black) Candle – Bearish: The close is lower than the open, reflecting seller control and downward pressure.
By observing colour and body length, traders gain an instant read on strength, conviction, and sentiment within the Futures K-Line Chart.
Understanding Timeframes: From Minutes to Months
A Futures K-Line Chart can be displayed across multiple timeframes, each serving a different trading objective.
Day traders focus on 1-minute to 15-minute charts for intraday execution. Swing traders typically analyse 1-hour, 4-hour, or daily charts to capture medium-term price swings. Long-term investors rely on weekly or monthly charts to assess broader market cycles.
The chart does not change—only the story it tells. Effective analysis depends on aligning the Futures K-Line Chart timeframe with your trading strategy.
🧭 How to Read Futures K-Line Charts Like a Pro
Once you’ve grasped the basics of a single candle, the next step is to read them together as a narrative. This involves understanding trends and using simple indicators to confirm your observations. This is where you transition from just seeing prices to understanding market behaviour.
Identifying the Main Trend: The Importance of “The Trend is Your Friend”
The primary goal of chart analysis is to identify the prevailing trend. You don’t need a complex tool for this; a simple visual inspection is often enough.
- Uptrend (Bull Market): Characterised by a series of ‘higher highs’ and ‘higher lows’. The overall pattern of candles moves from the bottom-left of the chart to the top-right.
- Downtrend (Bear Market): Characterised by a series of ‘lower highs’ and ‘lower lows’. The pattern moves from the top-left to the bottom-right.
- Sideways Market (Range-bound): The price oscillates between a relatively stable high (resistance) and low (support), without a clear upward or downward direction.
Trading with the trend is a fundamental principle that increases the probability of success. Identifying the trend is your first and most important analytical task.
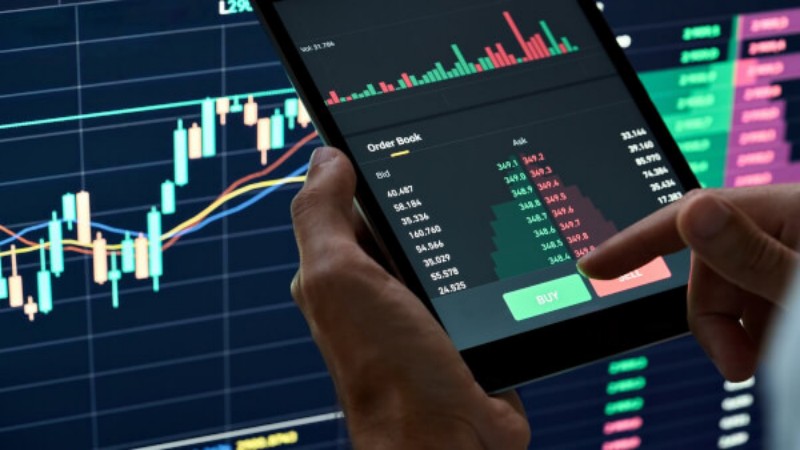
The Role of Volume: Confirming Chart Signals
Volume, typically displayed as bars at the bottom of the chart, represents the total number of contracts traded during a period. It’s a crucial indicator of conviction. Price action tells you what happened, but volume tells you how much conviction was behind it.
- Confirmation: In a healthy uptrend, volume should increase as prices rise and decrease as prices pull back. In a downtrend, volume should be higher on down moves.
- Divergence (Warning Sign): If a strong price move (either up or down) occurs on very low volume, it may lack conviction and be prone to reversal. This is a red flag that the current move might be a ‘fakeout’.
Always check the volume behind a significant candle or pattern. It separates a true signal from market noise.
Introducing Moving Averages (MA): The “Three Lines” Explained
Moving Averages (MAs) are one of the most popular and useful indicators. They smooth out price data to create a single flowing line, making it easier to identify the trend’s direction. Often, traders will plot several MAs on a chart—the so-called “three lines.” These are simply MAs calculated over different periods (e.g., short, medium, and long term).
The interaction between price and MAs, and between different MAs, can provide powerful trading signals:
| MA Period | Typical Length | Primary Use | Strategic Implication |
|---|---|---|---|
| Short-Term | 5, 10, or 20 periods | Capturing immediate momentum | Used by day traders and for fine-tuning entries. A price cross can signal a short-term shift. |
| Medium-Term | 50 or 60 periods | Identifying the primary trend | Acts as a dynamic support/resistance level. A sustained position above/below the 50MA often confirms the trend. |
| Long-Term | 100 or 200 periods | Defining the major market cycle | Considered a major indicator of the overall bull/bear market. A “Golden Cross” (50MA crosses above 200MA) is a major bullish signal. |
📊 Advanced Analysis: Decoding K-Line Patterns
If individual candles are letters, then patterns are sentences. Recurrent formations within a Futures K-Line Chart reflect collective trader psychology and often precede reversals or continuations.
Classic Reversal Patterns
If individual candles are letters, then patterns are sentences. Recurrent formations within a Futures K-Line Chart reflect collective trader psychology and often precede reversals or continuations.
- Head and Shoulders (Top & Bottom): A classic and reliable topping pattern (or an inverse pattern at a bottom). It consists of three peaks, with the central peak (the ‘head’) being the highest. A break of the ‘neckline’ signals a trend reversal.
- Double Top / Double Bottom: The price attempts to break a high (or low) twice and fails, forming an ‘M’ shape (top) or a ‘W’ shape (bottom). It signifies trend exhaustion.
- Engulfing Patterns (Bullish & Bearish): A two-candle pattern. A Bullish Engulfing occurs when a small red candle is followed by a large green candle that completely ‘engulfs’ the prior candle’s body, signaling a strong shift to buying pressure. The opposite is true for a Bearish Engulfing.
Key Continuation Patterns
Such formations indicate temporary consolidation before trend resumption, making them powerful tools within Futures K-Line Chart analysis.
- Flags and Pennants: These are short-term consolidation patterns. A ‘Flag’ is a rectangular consolidation, while a ‘Pennant’ is triangular. They typically form after a sharp price move (the ‘flagpole’) and often lead to another move of similar magnitude.
- Ascending / Descending Triangles: An Ascending Triangle has a flat top (resistance) and a rising bottom (support), indicating building bullish pressure that often resolves with an upward breakout. A Descending Triangle is the bearish opposite.
💡 Practical Trading Strategies Using K-Line Charts
Knowledge is useless without application. Let’s translate this chart analysis into concrete trading strategies you can start testing in 2025.
Strategy 1: Trend Following with Moving Averages Crossovers
- Concept: Use two moving averages, a faster one (e.g., 10-period) and a slower one (e.g., 50-period), to generate buy and sell signals.
- Buy Signal: When the faster MA crosses above the slower MA, it suggests upward momentum is building. This is a potential entry point for a long position.
- Sell Signal: When the faster MA crosses below the slower MA, it indicates downward momentum. This is a potential entry for a short position or an exit for a long one.
- Best Use: This strategy works best in clearly trending markets. It can produce false signals in sideways or choppy markets.
Strategy 2: Breakout Trading from Consolidation Patterns
- Concept: Identify a clear consolidation pattern, like a Triangle or Flag. These patterns represent a balance between buyers and sellers, and a breakout signifies a winner has emerged.
- Execution: Place a buy order just above the resistance of the pattern or a sell order just below the support.
- Confirmation: The breakout should occur on a surge in volume. A low-volume breakout is less reliable and more likely to fail.
- Benefit: Breakouts can lead to powerful and rapid price moves, offering excellent risk-to-reward opportunities.
Risk Management: Setting Stop-Loss based on K-Line signals
No strategy is foolproof. Professional trading is about managing risk. K-line charts provide logical places to set your stop-loss orders.
- For Long Positions: Place your stop-loss just below a recent significant low, the bottom of a bullish pattern (like a Bullish Engulfing), or below a key support level or moving average.
- For Short Positions: Place your stop-loss just above a recent significant high, the top of a bearish pattern, or above a key resistance level.
Operational clarity—such as understanding Ultima Markets Deposits & Withdrawals and reviewing Ultima Markets fund safety—supports disciplined risk management.
Conclusion
Mastering the Futures K-Line Chart is a process built through repetition, observation, and discipline. From candle anatomy to pattern recognition and strategy execution, this charting method remains one of the most enduring tools in futures trading.
Begin with simulation, refine your structure, and validate execution using reliable platforms. Independent feedback—such as Ultima Markets Reviews—can further support informed decision-making. Over time, the Futures K-Line Chart transforms from static data into a dynamic map of market behaviour.
FAQ
- What is the main difference between futures K-line charts and stock K-line charts?
Functionally, they are identical in how they are constructed (Open, High, Low, Close). The primary difference lies in the underlying asset and market dynamics. Futures charts often reflect leverage and can be more volatile, with trading activity concentrated around contract expiry dates. The principles of technical analysis, however, apply equally to both. - How reliable are K-line patterns?
No pattern is 100% reliable. They are probabilistic tools, not crystal balls. Their reliability increases significantly when confirmed by other factors, such as a corresponding increase in volume, a break of a key moving average, or alignment with the broader market trend. Always use patterns as part of a comprehensive analysis. - Which timeframe is best for day trading futures?
Day traders typically focus on shorter timeframes to capture intraday volatility. The 5-minute and 15-minute charts are very popular as they offer a good balance between providing enough detail for entry/exit signals without being overly ‘noisy’ like a 1-minute chart. Many traders also keep an eye on a higher timeframe chart (like the 1-hour) to stay aware of the dominant daily trend. - Can I use K-line charts effectively without any other indicators?
Yes. This is known as ‘price action trading’. Many successful traders focus solely on reading candlestick patterns, support/resistance levels, and trendlines. They believe that price action itself contains all the necessary information. However, for beginners, indicators like Moving Averages and Volume can provide valuable confirmation and context.
*This article represents the author’s personal views only and is for reference purposes. It does not constitute any professional advice.